Advertising disclosure
Hosting Canada is community-supported. We may earn a commission when you make a purchase through one of our links. Read Disclosure.
100+ Internet Statistics and Facts
Hey everyone, Gary here. As I write and review various software applications and service providers on hostingcanada.org, I come across a lot of interesting tidbits of information about the internet and its impact on society. This page is sort of a living document "catch all" for anything that catches my eye.
Some of these statistics will likely surprise you, and perhaps even question whether they are true (all sources have been cited along side the stats themselves, so please feel free to fact-check everything and email me if something seems amiss). Enjoy. 🙂
Internet Statistics 2021
- There were 480 million more Internet users than there were in 2016. That brings us to a whopping total of 3.74 billion global Internet users.
- Despite the ongoing adoption of the internet, it's actually getting less free. The total number of Free countries - ie, that have the least amount of Internet Censorship - actually decreased by 6% from 2015 to 2020.
- Asia has more Internet users than anyone. Half of the world’s Internet users live in Asia. Asia has seen a numerical and a percentage increase in the number of Internet users as opposed to 2016. The only continent to come close is Europe, with 17 percent of worldwide users.
- China is number one in Internet users, with more than 371 million users at the time we wrote this. That’s one quarter of the world’s Internet users. This increase is something to take note of because in 2016, China only represented around 21.97 percent of global Internet users.
- China’s Internet users are more than twice the population of the USA.
- Around 9.2 million people of the United Arab Emirates use the Internet. A surprising 99 percent of United Arab Emirates citizens use the Internet. This is not seen anywhere else in the world.
- $2.1 trillion is the number of sales that in one way or another was connected to the Internet. This was only in 2016.
- In 2017, it is expected that more than $205 billion is going to be spent on Internet-based ads. This will be the first time Internet ads exceed television ad spending, which is expected to come in at around $192 billion.
- Everyday two million blog posts are published.
- More than 660 million pictures are posted on just Instagram every day.
- Everyday 5.5 billion Google searches are performed.
- MongoDB is the most popular database hosting solution with over 24, 292 companies using MongoDB.
Domain Name Statistics
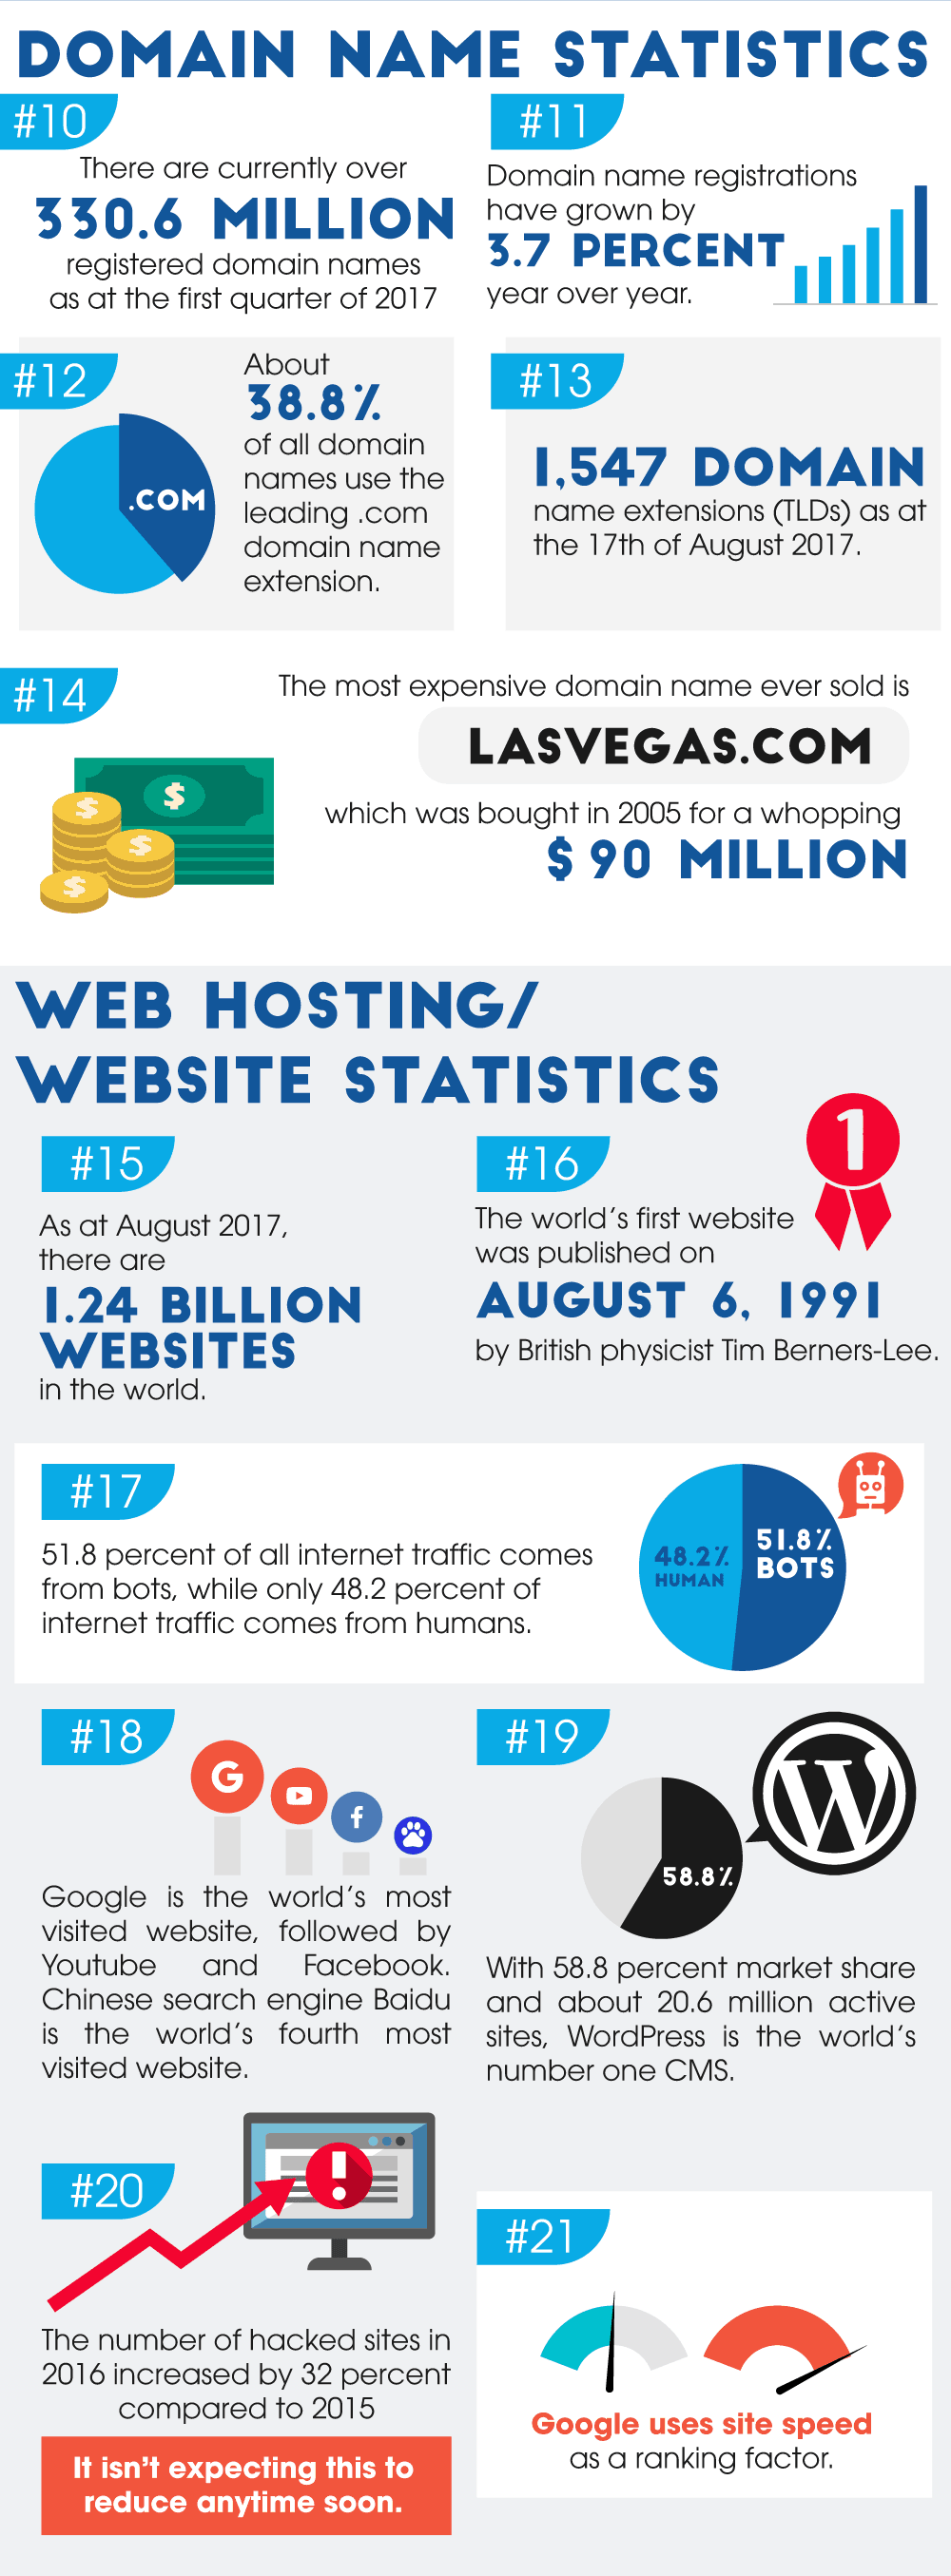
- As of the first quarter of the year 2017, over 330 million domain names were registered. Now you know why you can’t find a domain name. But fret not, I’ve included a domain name generator that might help you.
- Domain name registrations have increased to the tune of 3.7 percent every year.
- 38.8 percent of the domain names registered have the extension “.com”
- As of August 17, 2017, there were more than 1,547 domain name extensions.
- Can you guess the most expensive domain name ever sold? If you guessed Las Vegas.com for a whopping $90 million, you would be correct.
Video Marketing Statistics

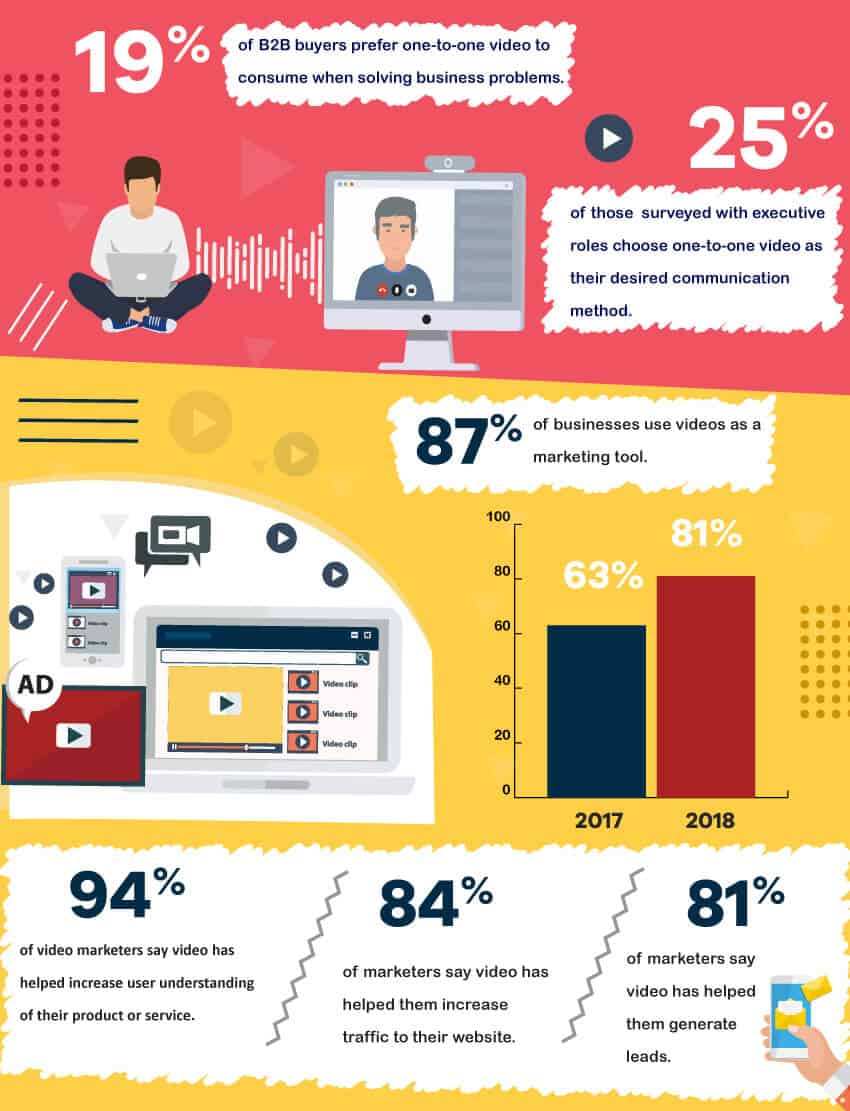
- 19% of B2B buyers prefer one-to-one video to consume when solving business problems. (source)
- 25% of those surveyed with executive roles choose one-to-one video as their desired communication method. (source)
- 87% of businesses use videos as a marketing tool. (source)
- 94% of video marketers say video has helped increase user understanding of their product or service. (source)
- 84% of marketers say video has helped them increase traffic to their website. (source)
- 81% of marketers say video has helped them generate leads. (source)
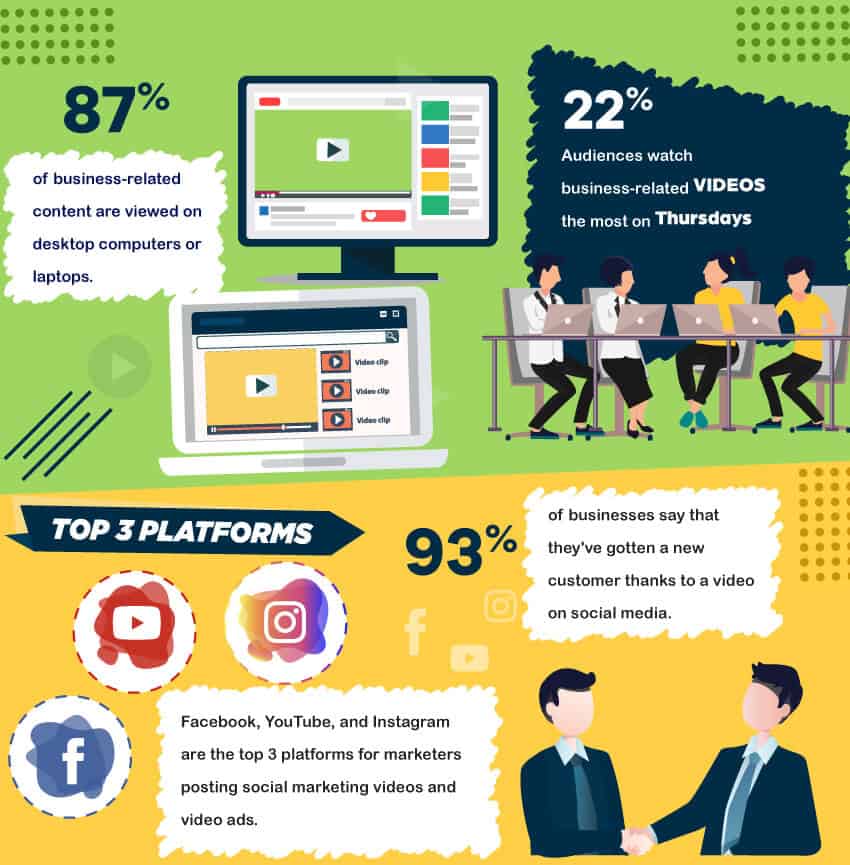
- 87% of business-related content are viewed on desktop computers or laptops. (source)
- Audiences watch business-related videos the most on Thursdays (22%). (source)
- Facebook, YouTube, and Instagram are the top 3 platforms for marketers posting social marketing videos and video ads. (source)
- 93% of businesses say that they've gotten a new customer thanks to a video on social media. (source)
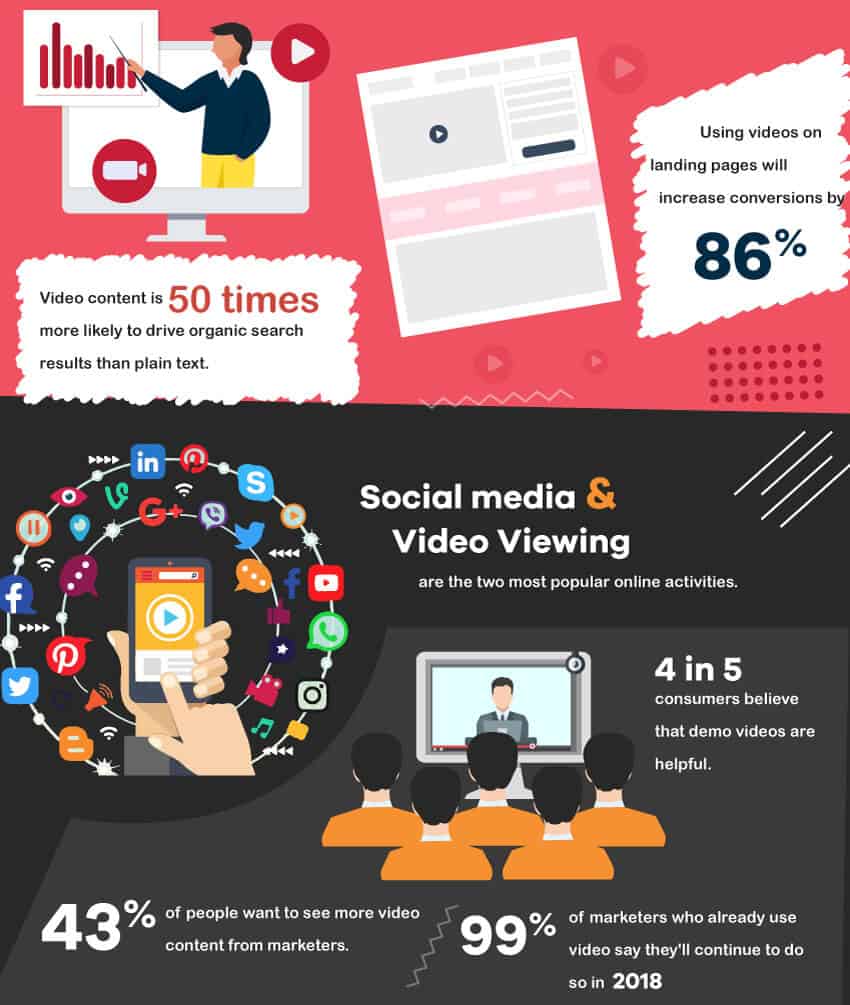
- Video content is 50 times more likely to drive organic search results than plain text. (source)
- Using videos on landing pages will increase conversions by 86%. (source)
- Social media and video viewing are the two most popular online activities. (source)
- 4 in 5 consumers believe that demo videos are helpful. (source)
- 43% of people want to see more video content from marketers. (source)
- 99% of marketers who already use video say they'll continue to do so in 2018. (source)
These video marketing statistics and much more are highlighted in the infographic below. Check it out to see how video can help your business get more traffic and convert more of that traffic into paying, loyal customers. Note that video marketing is a massively growing marketing channel online, and as such we will update these statistics regularly as the industry evolves.
The following findings are based on first-hand data collected from a sample of Vidyard customers, including more than 324,000 videos over a 12-month period, from January 1, 2018 to December 31, 2018.
- The most popular viewing times are midweek, Tuesdays to Thursdays, 9AM-11AM PST.
- 87% of business-related video views take place on desktop browsers and only 13% on mobile.
- 52% of small and medium businesses now use a combo of internal and external resources to produce videos.
- High tech and professional services industries publish the most new videos annually.

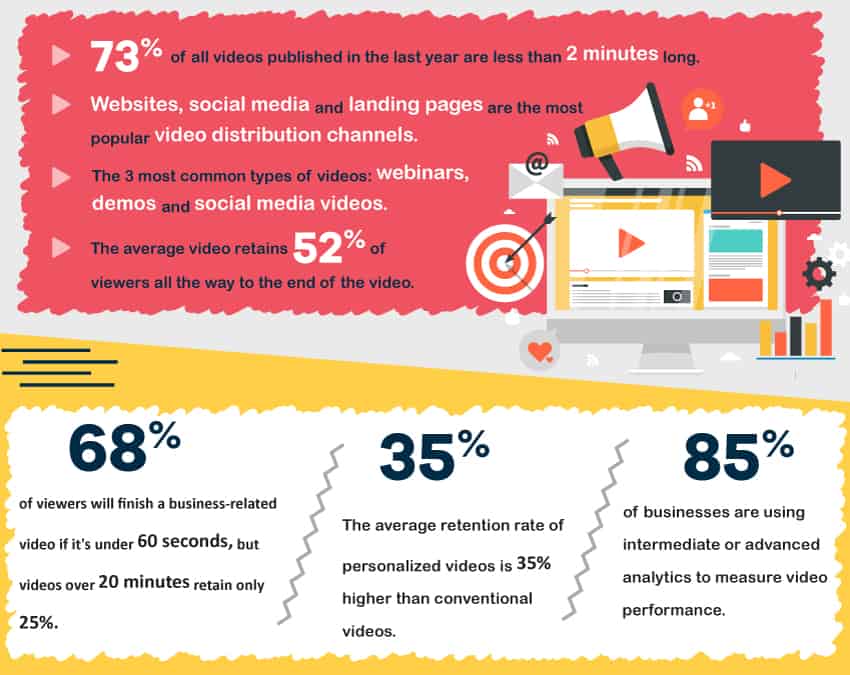
- 73% of all videos published in the last year are less than 2 minutes long.
- Websites, social media and landing pages are the most popular video distribution channels.
- The 3 most common types of videos: webinars, demos and social media videos.
- The average video retains 52% of viewers all the way to the end of the video.
- 68% of viewers will finish a business-related video if it's under 60 seconds, but videos over 20 minutes retain only 25%.
- The average retention rate of personalized videos is 35% higher than conventional videos.
- 85% of businesses are using intermediate or advanced analytics to measure video performance.
Web Hosting &Website Statistics
- 1.24 billion is the number of websites on the planet as of August 2017.
- Trivia question: Who published the first website, and when was it published? Ted Burners–Lee on August 6, 1991.
- Coming in at 51.8 percent of all Internet traffic, bots do more “surfing” than humans who only count for 48.2 percent of online traffic.
- YouTube is the second most visited website on the planet. Number one is Google, number three is Facebook, and number four is the Chinese site Baidu.
- Since its creation in 2004, the CMS WordPress has managed to grab 58.8 percent of the market share, with an impressive 20 million active sites including Facebook, New York Times, and Forbes.
- There was a 32 percent increase in hacked sites from 2015 to 2016. There’s no reason to expect this number to get any smaller in the coming years. That’s why we’re including a link to this guide on detailing how you can keep your WordPress site hacker free.
- Google uses site speed for its ranking.
Conversion and E-Commerce Statistics
- Currently, more than $2 trillion a year comes from e-commerce accounts.
- Out of $92 used in generating traffic, only one dollar goes to converting customers. Unfortunately a couple of those dollars also goes to cybercrime! Ouch. Read my guide to the best Canadian VPN to learn how to protect yourself.
- Did you know that 65 percent of shoppers won’t pay for shipping when ordering online? Thirty-five percent will pay to get their things shipped.
- Even when you buy from a brick-and-mortar store, $.56 out of every dollar is the result of some digital interaction.
- Only 23 percent of businesses are satisfied with their current conversion rates.
- Men spend 28 percent more online than women.
- Most people spend about five hours a week shopping online.
- Most Americans, approximately 95 percent of them, shop online.
- Price is a determining factor for 87 percent of American shoppers. For 80 percent, the price of shipping coupled with delivery speeds are what’s important. Seventy-one percent choose where they will buy from based on whether or not discounts are offered.
- There’s a good reason to go after the top Google results search spot. If you have the top spot, you have a 34.36 percent click through rate if the person is using a desktop computer. If they’re using a mobile device, you have a 31.35 percent click through rate.
- Does your business calculate its return on investment? If so, there is a 72 percent chance it has an effective marketing strategy.
- Tired of being asked to turn off your ad blocker? There’s a good reason why businesses do it. In just 2015, ad blockers affected business in the amount of approximately $22 billion.
- Fifty-eight percent of people say they want the first sales call they receive to discuss pricing. However, 65 percent say they want that first call to be goal focused.
- Marketplaces account for 45 percent of e-commerce sales, with branded stores picking up the other 55 percent.
- Amazon accounts for 80 percent of online marketplace sales.
- Did you know that most people spend approximately $488 annually shopping via online marketplaces?
- Not getting a reply to your email? Maybe you sent it on Thursday. Thursdays is the worst day for emails to be sent. Wednesday is the best.
- Slow loading website bothering you? You’re not alone. It’s estimated that $1 trillion is lost every year to the e-commerce market as a result of websites that load slow.

- Eighty percent of customers say they’ll buy something online as long as the shipping is free.
- If the business offers personalized recommendations, they may increase their conversion rates 5.5 fold.
- Fifty-one percent of US-based shoppers say that they will abandon a purchase if the website they are shopping on loads too slow.
- People love using their mobile device to get on the Internet. However, people who use a tablet or desktop are more inclined to purchase. It has been shown that 8.5 percent of people who look at a site on their desktop actually put something in the cart, with 2.78 percent of these individuals actually buying something. Comparatively, when a person is shopping on their smartphone only 4.7 percent will put something in their cart, and only 0.8 percent will actually buy something. There is a little wiggle room in these numbers, but the desktop is the clear leader.
- If you can get your website loading speed from eight seconds down to two seconds, you could see a 74 percent increase in conversion rates. This is based on information gathered by more than 30 big-name retailers.
- Do you want proof that people have a short attention span? In 2010, if a webpage needed six seconds to load, there would be a 40 percent reduction in conversion. Today, a website with the same six second load time will have a 50 percent conversion loss.
- Only three percent of mobile shoppers purchase the items in their cart. Between 25 percent to 30 percent of desktop shoppers purchase the items in their cart.
- If someone tells you that you have the attention span of a goldfish, consider it a compliment. That’s because a goldfish has a nine second attention span. In 2000, the average human had a 12 second attention span. In 2017, that number has dropped to only eight seconds. This information is the result of a survey that Microsoft Corporation did on more than 2,000 people. Additionally, they monitored the EEG information of another 112 people.
- B2C global e-commerce sales were around $1.7 trillion in 2015. By 2018. that number is expected to break $2.35 trillion.
- Websites with a one second loading delay are likely to produce a seven percent conversion loss. If your visitors experience loading times of three seconds, approximately 40 percent of them will leave your site. Website builders are an easy fix for this.
Thanks to our infographic team for putting this together!
For more info check out our web hosting reviews page.

